Interactive capabilities of a spreadsheet document. Interactive capabilities of spreadsheet document 1c 8 spreadsheet document
A spreadsheet document is used to create primary documents and reports, which consist of cells organized into rows and columns. Each row and column has its own unique number. In this case, individual cells, ranges and graphic objects can be named by selecting the desired area using the "Table - Names" section. Then enter the name in the input field and click “Assign”.
In order to delete a name, select it from the list and click on the "Delete" button. The areas that the user has not assigned a name to, the program will give a name automatically. These names can be seen in the Properties palette. The spreadsheet editor can be used to create a new document, view the results of previous reports, and edit tabular documents.
How to create a spreadsheet document in 1C
To create a new document, click on the "File" - "New" section, then select the "Tabular document" line and confirm with the "OK" button. If you need to open an already created document, then in the "File" - "Open" section, select the file name of the required document from the list. In this case, you can select any format of the opened document by clicking on the "File type" field.
When creating a table, select a cell and enter data (text, formula, numerical data). If you need to change the size of the cells, then in the Menu select “Format - Line - Auto-fit - Column - Auto-fit”. To do this, move the mouse over the border of the row or column header while holding left button mouse, drag to resize. The height of the row of the spreadsheet document and the width of the column will be modified in 1C. The auto-fit command is opened by double-clicking on the header border.

You can safely repeat all actions in your database or easily create a spreadsheet document in 1C: Ready-made solutions - cloud version licensed program 1C. Test the service for free for 14 days in 1C Online.
How to change the row height and column width in 1C
The rows and columns of a spreadsheet document can be resized manually or automatically.
In the 1C program, the line height of the spreadsheet document will change manually if you hover the mouse over the bottom border of the row header and wait for the mouse cursor to transform into a forked vertical arrow. After that, we set the line height we need by moving the borders of the header.
You can change the column width by positioning the mouse pointer over the right border of the header and waiting for the mouse cursor to transform to a horizontal forked arrow. Move the border of the title with the mouse and set the required width.
The minimum required column width can be set with two mouse clicks on the header border. The editor will independently set the width in which the text completely fits.
There is another way to manually change it. Press the “Ctrl” key and move the mouse over the required cell border. After the shape of the cursor changes, set the desired size.
In 1C, the column width of the spreadsheet document will change automatically, if you select the required column and select the section "Table" - "Cells" - "Column width". In the window that appears, specify the width and click "OK".

When creating a new spreadsheet document, the width of all columns is set by default. But it can also be changed. To do this, in the “Table” select “Cell” - “Column width”. In the window that appears, set the column size and click "OK". If you select "Auto" then the size is set to fit the entire document.
The line height will automatically change if you check the "Auto line height" checkbox. If the checkbox is not checked, then a fixed line size is set in the "Line height" field.
In order to set different column widths for different lines, you need to select one or more lines of the document.

Move the mouse over the column separator and press the left mouse button. Without releasing the button, drag the column in the desired direction (for example, to the left) and release the button. In the window that appears, click on "OK".

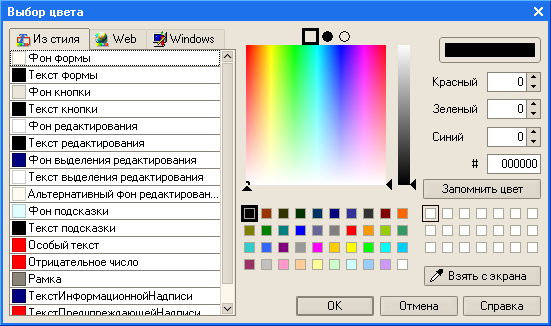
You can also control the color of the text, background, and borders.

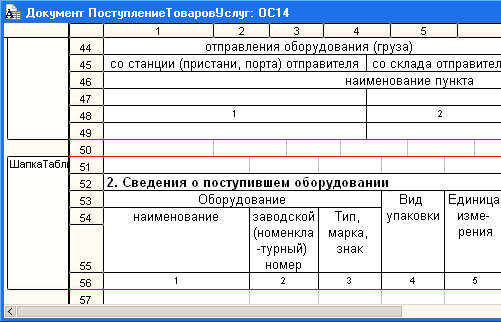
As a rule, a spreadsheet document is formed on the basis of a layout, which is a template for forming a printing form. You can include pictures, diagrams, and pivot tables in the layout itself. The example shows a layout for printing an invoice:

Some cells contain only text, others contain the names of parameters that must be specified in the program module through the “Parameters” of the “Spreadsheet Document” objects.
Grouping Rows in a Spreadsheet Document
In a spreadsheet document, it is possible to group rows and columns in order to classify data in reports. There are horizontal groupings that can be placed on the right or left, and vertical ones placed at the top or bottom.
Grouping levels can also be displayed. When you press the numbers in the header, all groupings are expanded at once. When grouping is applied, the indent of levels is generated automatically:

Decoding of spreadsheet document 1C
Let's use the decryption mechanism to get a detailed or additional report. To do this, click with the mouse on the line or cell of the document.
There are two steps to decrypting a document:
- Standard - click with the mouse on a document or a directory element, after which the system will open this object for viewing.
- Non-standard - set the algorithm for obtaining a detailed report. To do this, you need to reorganize the existing one using additional selection conditions ("show sales only for this counterparty"). Or,
When using the decryption, you can get a completely new report (for example, "show the invoices that contributed to the sales volume for this counterparty").

Since the call of reports contained in a specific application solution is performed automatically, this complicates the user's work. In order to facilitate the work, a decryption mechanism is needed.
How to save a spreadsheet document in 1C
In order to be able to use the spreadsheet document in the future (open, view, print), you must save it. Select the "File" section and click "Save". After that, a window will appear on the screen in which we indicate the directory and file name. If you need to rename the document, or save it in a different format, select the "File" and "Save As" sections.
As a rule, the document is saved in the format used by the 1C: Enterprise system (* .mxl). In this case, the spreadsheet document can be exported to other formats data storage, in including in ODF spreadsheet format (* .ods), Word document(* .docx), HTML document (* .htm) or in text file UNICODE (* .txt). In addition, it is possible to save a spreadsheet document in excel or pdf in 1C.

Printing a spreadsheet document in 1C
To preview the document before printing, select the "File - Preview" section. To get out of preview press the "Close" button.
In the page settings, set in 1C the print parameters of the spreadsheet document - scale, size, borders, etc. In the spreadsheet editor, set the parameters for placing rows and columns. Position on Page enforces pagination, repetition of rows and columns, and so on.
Let's output the document to the printer by clicking on the "File" - "Print" section. A window with settings will appear on the page, where you need to set print parameters - select a printer, page range and number of copies - and click "OK".
Do you have any questions? Ask them in the comments and wewe will definitely answer them.
In order to account for money and goods, different tables are widely used in business. Almost every document is a table.
One table lists the items to be shipped from the warehouse. In another table, there are obligations to pay for these goods.
Therefore, in 1C, work with tables occupies a prominent place.
Tables in 1C are also called "tabular sections". Reference books, documents and others have them.
The query, as a result of its execution, returns a table, access to which can be obtained in two different ways.
The first - faster - selection, retrieving rows from it is possible only in order. The second is unloading the query result into a table of values and then random access to it.
// Option 1 - sequential access to query results
// get the table
Selection = Query.Run (). Select ();
// in order, we go through all the rows of the query result
While Fetch.Next () Loop
Report (Sample. Name);
End of Cycle;
// Option 2 - unloading into a table of values
Request = New Request ("SELECT Name FROM Directory.Nomenclature");
// get the table
Table = Query.Run (). Unload ().
// then we can also go through all the lines
For each Row from Table Loop
Report (String.Name);
End of Cycle;
// or arbitrarily access strings
String = Table. Find ("Shovel", "Name");
An important feature is that in the table that is obtained from the query result, all columns will be strongly typed. This means that by requesting the Name field from the Nomenclature reference book, you will receive a column of the type String with an allowable length of no more than N characters.
Table on form (fat client)
The user works with the table when it is placed on the form.
We discussed the basic principles of working with forms in the lesson on and in the lesson on
So, let's place the table on the form. To do this, you can drag the table from the control panel. Similarly, you can select in the menu Form / Insert Control.


Data can be stored in the configuration - then you need to select the existing (previously added) tabular section of the configuration object whose form you are editing.
Click the "..." button in the Data property. In order to see the list of tabular sections, you need to expand the Object branch.
When choosing a tabular section, 1C itself will add columns to the table on the form. The lines entered by the user into such a table will be saved automatically along with the reference / document.

In the same Data property, you can enter an arbitrary name and select the ValuesTable type.
This means that an arbitrary table of values has been selected. It will not automatically add columns, it will not be automatically saved, but you can do whatever you want with it.
By clicking right click on the table you can add a column. In the properties of the column, you can specify its name (for reference in the 1C code), the column heading on the form, the link with the tabular section attribute (the latter - if not an arbitrary table, but the tabular section is selected).

In the properties of the table on the form, you can specify whether the user can add / remove rows. More advanced form - checkbox View Only. These properties are useful for organizing tables for displaying information, but not editing.

To manage the table, you need to display the command bar on the form. Select the menu item Form / Insert Control / Command Panel.

In the properties of the command bar, select the Autocomplete checkbox so that the buttons on the bar appear automatically.

Table on Form (Thin / Managed Client)
On a managed form, these actions look slightly different. If you need to place a tabular section on the form, open the Object branch and drag one of the tabular sections to the left. And that's it!

If you need to place a table of values, add a new attribute of the form and in its properties specify the type - table of values.

To add columns, use the right-click menu on this form attribute, the Add attribute column item.

Then also drag the table to the left.

To make the table have a command bar, in the table properties, select the values in the Usage - Command bar position section.

Export a table to Excel
Any 1C table located on the form can be printed or downloaded to Excel.
To do this, right click on free space in the table and select Display List.

In a managed (thin) client, similar actions can be performed using the All actions / Display list menu item.

For all output documents (primary documents and reports) in the 1C: Enterprise system, a single format is provided - the format of tabular documents. A spreadsheet document is a powerful interactive means of displaying information and can be used both by itself and as part of any of the forms used in the application solution. At its core, a spreadsheet document resembles a spreadsheet - it consists of rows and columns that contain data, but its capabilities are much wider:
Cell decoration
The spreadsheet document has great design possibilities. The developer can set the type and size of the font for displaying the text located in the cells of the spreadsheet document:
A spreadsheet document allows cells to be decorated with frames of various types:

Also, the developer has the ability to control the color of text, background and frames, choosing colors from the palette operating system, and from the Web-color palette supported by the platform, or from the palette of the style that will be used by the application solution:
Groupings
The spreadsheet document supports the ability to group rows and columns. This allows you to group data in reports using an arbitrary number of nested groupings.
There are horizontal and vertical groupings, and the developer has the ability to control the arrangement of totals in the grouping: for vertical groupings they can be located at the top or bottom, and for horizontal groupings - on the right or left.
The display of grouping levels is supported, and by pressing the numbers in the headings, you can expand all the groupings of a given level at once and collapse more detailed groupings.
The indentation of hierarchy levels when using groupings is generated by the system automatically:

Decryption
The system supports a decryption mechanism that allows the user to get a detailed or additional report by clicking on a row or cell of a spreadsheet document. The platform supports the ability to process mouse clicks in the cells of a spreadsheet document. In this case, the system can perform both standard actions and algorithms specified by the developer.
Standard actions during decryption are performed, for example, if you click the mouse on a document or a reference item. In this case, the system will open this object for viewing (unless otherwise provided by the developer).
Processing of non-standard decryptions is performed using the built-in language. For example, a developer can set an algorithm for obtaining a detailed report by re-forming an existing one using additional selection conditions ("show sales only for this counterparty"). Or, using the decryption, the user can get a completely new report (for example, "show the invoices that contributed to the sales volume for this counterparty").

The decryption mechanism makes it possible to significantly facilitate the user's work, since the call of certain reports contained in a particular application solution occurs automatically and does not require the user to specify the initial parameters. The settings for the desired report can be determined automatically based on the context in which the user calls this report.
Notes (edit)
The developer has the ability to set notes for individual cells or groups of cells in the document. The note cell has a small triangle in the upper right corner. When you hover over a cell, the annotation is displayed in a pop-up window. Using notes, you can add additional (reference) information to spreadsheet documents that is not displayed on the screen (in normal mode), but can be easily viewed if you move the mouse cursor to the desired cell:

Column width
The spreadsheet document supports the ability to set different column widths for different rows. This feature is very important for regulated reporting. In fact, in this case, a spreadsheet document will represent several tables, which, for example, is often found in accounting and tax reporting:
Pivot tables
A spreadsheet document can contain pivot tables. Pivot tables are a powerful tool for programmatically and interactively presenting multidimensional data.
For a pivot table, the user can independently set the composition of rows, columns and displayed data by simply dragging the required fields into the pivot table with the mouse. Such a table, for example, can display the volume of sales in the context of contractors and item names. Measurement values are displayed at the top of the table and in the sidebar, and the cells in the data area contain summary information at the intersection of the measurement data. The user can add or remove dimensions and resources, change their relative position.

The pivot table automatically changes the composition of rows, columns and their formatting, in accordance with the data that is placed in it; in addition, the system supports several standard pivot table design options that can be used by the developer. All this makes pivot tables the easiest tool for analyzing multidimensional data, since the developer requires minimal effort to create them:
Additional Information
You can get acquainted with the use of pivot tables in real time. To do this, you can download the demo video "An example of developing a trading mini-system", which shows the process of developing a trading mini-system using a pivot table in the Sales Analysis by Period report.
Entering data into a spreadsheet document
Although tabular documents in the 1C: Enterprise 8.0 system are mainly used to represent already processed information, it is possible to directly enter data into a tabular document as in a "normal" spreadsheet.
In the process of entering data into cells of a spreadsheet document, they can be processed by procedures in the built-in language, and the results of such processing can be used when calculating other cells of a spreadsheet document.
Direct data entry into a spreadsheet document can be used, for example, when forming a balance sheet:

Preservation
Since a spreadsheet document is most often used to generate output documents, it can be saved to a file on disk for later use or transfer to other computers. The spreadsheet document can be saved in both own format, and exported to other data storage formats, including Excel sheet or MXL7 format (for compatibility with platform version 7.7):
Spreadsheet Document Editor
To create layouts, from which, as a result, a tabular document will be formed, shown to the user, the developer can use the tabular document editor - a powerful tool that combines the design capabilities of a tabular structure and vector graphics... It allows you to create both small documents with a very complex structure of lines (such as a payment order), and voluminous statements, magazines, etc.
Tabular document 1C: Enterprise 8 serves not only for printing documents and reports. It has advanced features that turn it into an interactive user experience. These opportunities include:
- transcripts,
- groupings,
- notes.
It is worth noting that pivot tables and controls located in cells can also be attributed to the interactive capabilities of a spreadsheet document, but now we will not dwell on them, but take a closer look at the above mechanisms.
Decryption
System "1C: Enterprise 8" supports the mechanism of decryption (drill-down, drill-through), when the user clicks on a row or cell of the report and receives a more detailed report, if of course it is provided by the programmer.
Decryptions are divided into standard and non-standard. Standard transcripts are processed by the system automatically and do not require additional efforts from the programmer, for example, the document form will be opened for documents, and the element form will be opened for directory elements. If the directory is edited in a list, the cursor will be positioned on the current element in the form of a list. To perform non-standard decryption, the Decryption Handling event is intended.
The "DecodeProcessing" event can be processed only if the spreadsheet document is placed in the form as a control, and does not open in a separate window, since this event exists only for the "TabularDocumentField" control. Shown below is the Events property category of the TabularDocumentField control where the decryption handler procedure is assigned.
The procedure "DecryptString" itself may look like this (as an example):
Procedure DecryptString (Element, Decryption, StandardProcessing)
If TypeZnch (Explanation) = Type ("DocumentLink. Sales Agreement") Then
StandardProcessing = False;
Report = Reports.Analysis of the Agreement.Create ();
Report.Atract = Decryption; // fill in the details of the report
Report.Generate (Form Elements.Table Document Field1);
EndIf;
End of Procedure
Note 1... In the application module (analogous to the global module in version 7.7), there is no longer the ProcessCellTable event. All processing of transcripts should be done in the form module, where the "TabularDocumentField" control is located.
Note 2... The "ProcessingDecryption" event occurs when you click on a cell or figure containing a decryption. Do not confuse it with the Select event, which occurs for all cells and images when double click mouse or by pressing the Enter key, and, first, the "Select" event occurs, and then the "Decryption Processing" event.
Groupings
In 1C: Enterprise 8, it became possible to group data in a report. Groupings can be horizontal and vertical, then special markers appear on the left and above, allowing the user to expand and collapse groups.
The easiest way to add groupings to a report is to entrust this task to the system, then the programmer will need minimal effort. You just need to apply the StartAutoRowGrouping / StartAutoColumnGrouping and EndAutoRowGrouping / EndAutoColumnGrouping methods, which enable the mode of automatic grouping of rows or columns, respectively. In this mode, when calling the Output (for strings) and Append (for columns) methods, additional parameters for grouping are specified:
Output (<Таблица>, <Уровень>, <Имя группы>, <Открыта>)
Join(<Таблица>, <Уровень>, <Имя группы>, <Открыта>)
When using groupings, it is very useful to set the cell property "Auto Indent" to some nonzero value, for example, 5. Then the system will automatically add the specified number of spaces to the left of the cell text based on the current grouping level. As a result, the report will acquire a convenient appearance to display the data hierarchy.
The following example displays a list of products with groupings:
TabDoc = New TabularDocument;
Region = Layout.GetScope ("Row");
Selection = Directories.Nomenclature.SelectHierarchically ();
TabDoc.StartAutoGroupLines ();
While Sampling.Next () Loop
Scope.Parameters.Nomenclature = Selection.Ref;
TabDoc.Output (Area, Selection.Ref.Level (), Selection.Name, True);
End of Cycle;
TabDoc.FinishAutoGroupLines ();
TabDoc.Show ();
Notes (edit)
Cells of a spreadsheet document can have notes, then a small red triangle is displayed in the upper right corner of the cell. When you hover the mouse over a cell, the annotation is shown in a pop-up window.
Programmatic setting of notes is implemented as follows:
TabDoc = Form Elements.TableDocumentField1;
TabDoc.Clear ();
Layout = Directories.Nomenclature.Get Layout ("Catalog");
Selection = Directories.Nomenclature.Select ();
While Sampling.Next () Loop
LayoutCellsArea = Layout.Area ("CellName");
Layout CellSpace.Note.Text = Selection.Ref.Comment;
AreaTabDoc = Layout.GetArea ("Row");
ScopeTabDoc.Parameters.Nomenclature = Selection.Ref;
TabDoc.Withdraw (RegionTabDoc);
End of Cycle;
Note that the Note property of the Layout CellSpace object is a Picture object, not a simple string. Through this object, you can edit the appearance of the note, font and text color, background, lines, etc.
Summary
- The spreadsheet document serves not only for printing documents and reports, but also has powerful interactive capabilities. These capabilities primarily include transcripts, groupings, and annotations (discussed in this section), as well as pivot tables and controls (discussed in other sections).
- Non-standard decryption, i.e. processed by the programmer, can be implemented if only the spreadsheet document is displayed on the screen (the "TabularDocumentField" control).
- The easiest way to use groupings is to turn on the auto-grouping mode for rows, and when displaying each area in a spreadsheet document, indicate the level to which it belongs. It is also recommended to set the "Auto indent" property for the required cells in the layout.
- Notes "float" when you hover over a cell. It is possible to change the appearance of notes using the built-in language.
Most of the teaching materials on programming in the 1C system when describing the formation of printed forms based on an object "Tabular document" are limited to displaying the finished form on the screen. For users, it is much more important how the document will look when printed. Here, in addition to a well-designed layout, print settings also play a role.
Almost all the parameters available in the print settings dialogs (printer settings, page properties) can be specified directly when generating a spreadsheet document.
Let's consider the properties and methods of a spreadsheet document related to printing settings (in the examples given, "TabDok" is an object of the "Spreadsheet document" type).
Property "PrinterName" allows you to set a printer other than the default for printing. The name must match the name of the printer set on the system:
TabDoc. PrinterName = "HP LaserJet 3050 Series PCL 6";
When printing a batch of documents, you can save time by setting the collate flag:
TabDoc. ParseCopy = true;
The number of copies can be specified as follows:
TabDoc. Number of copies= 5 ;
Of course, you can set the fields:
TabDoc. Left Field = 20; // Left margin 20mm, other margins 10mm (default)
A few more page properties:
TabDoc. OrientationPages=
OrientationPages... Landscape;
TabDoc. InstancesOnPage=
2
;
// 2 pages will be placed on the sheet
TabDoc. Autoscale = true; // similar to page-width zoom settings
If necessary, you can specify a specific scaling value in percent (property "Print Scale").
Property "Page Size" allows you to set standard page sizes - “ A 3 ”,“ A4 ”,“ A 5” (full list options are available in the 1C help).
TabDoc. Page Size = "A3"; // letter A must be English
For a custom paper size (Custom), you can specify the values for the height and width of the page (in mm):
TabDoc. Page Size = "Custom"; // custom size
TabDoc. Page Height = 350;
TabDoc. Page Width = 350;
Also in the spreadsheet document control of the output of headers and footers and their content is available. This is done using the properties "Page header" and "Footer". For example:
TabDoc. Page header... Output = true; // will print the header
TabDoc. Header Size Top=
7
;
// footer size 7mm (default 10mm)
TabDoc. Page header.
Vertical position=
Vertical position... Top;
TabDoc. Page header.
Start page=
2
;
// the footer is displayed from the second page
FontHeader= New Font ("Courier New", 8, True);
TabDoc. Page header... Font = Font;
// italic font
TabDoc. Page header... TextInCenter = "Page header";
TabDoc. Page header... Text Right = "Page [& PageNumber] of [& PagesTotal]";
//pagination
TabDoc. Page header... Left Text = "[& Date]"; //The current date
The generated document is sent to print using the method "Type()". There are two possible call options.
1) Directly to the printer:
TabDoc. Print (. Do not use);
TabDoc. Print (true);
2) Before printing, the print dialog will be displayed:
TabDoc. Print ( Usage ModePrint Dialogue... Use );
TabDoc. Print (false);
In addition, you can control the pagination of the document. You can estimate the number of pages in a document based on the settings of the current printer as follows:
TabDoc. Number of pages();
Using methods "CheckOutput ()" and "CheckConnection ()" You can determine whether a spreadsheet document or an array of spreadsheet document areas fits on the page in height and width at the current printer settings.
It should be borne in mind that the work of the last three methods depends on the installed printer. If the method cannot find it, an exception is thrown.
To force the insertion of page breaks, the methods allow"DisplayVerticalPage Separator ()" and "DisplayHorizontalPage Separator ()".
Thus, you can control the page-by-page printing and control the page filling:
If Not TabDoc. CheckOutput ( ArrayOf OutputArea) Then
TabDoc. DisplayHorizontalPage Separator();
EndIf;
An important characteristic of the 1C: Enterprise 8.2 platform is the strict separation of properties and methods according to the execution context. If all of the above properties are available in any context, then the listed methods are not available on the thin client. An exception is the "Print ()" method, the availability of which is, for obvious reasons, limited to the client side. This means that the formation of a spreadsheet document should take place on the server, and it should be sent to print in the client procedure.
 Backlash of the volume and power buttons on the iPhone - a marriage or not?
 The network card does not see the cable: instructions for solving the problem What to do if the Internet cable does not work
 StoCard and Wallet: discount cards from the application