System monitoring in mac os. OS Track: Mac OS X system monitoring. Search and filters
Apple makes very reliable computers that can run for weeks or months without a reboot. Yes, and OS X, a pretty smart operating system that intelligently allocates system resources. Usually there is no need for an ordinary user to look behind the scenes of all this "kitchen", but if you want to control all the system resources of your Mac, you cannot do without special applications. These applications will be discussed in this article.
iStat Menus
One of the most famous utilities that provides detailed information about all the hardware components of your Mac (looking ahead, I will say that this is my favorite). The application allows you to fine-tune the display of the necessary elements directly on the menu bar, as well as arrange the necessary information in the drop-down menu. For example, I have processor, memory, battery, and network activity indicators in the menu bar, and with a glance I can always see how loaded the Mac is at the moment.
The display of information in the drop-down menu is implemented very conveniently, when hovering over a specific element, detailed consumption graphs are shown (per day, per week, per month). In addition, iStat Menus allows you to adjust the fan speed and create profiles for this.
If you want to monitor absolutely all the resources of your Mac - iStat Menus is ideal.
gfxCardsStatus
 If you are the owner of a Mac with two video cards, I advise you to pay attention to this application. By default, the user cannot choose which graphics card to use because OS X switches between integrated and discrete graphics depending on the current load. The tiny free utility gfxCardsStatus aims to remedy this shortcoming. Now, if you need high performance or, on the contrary, maximum energy savings, you just need to select the appropriate item in the gfxCardsStatus menu. All in your hands!
Disk Doctor
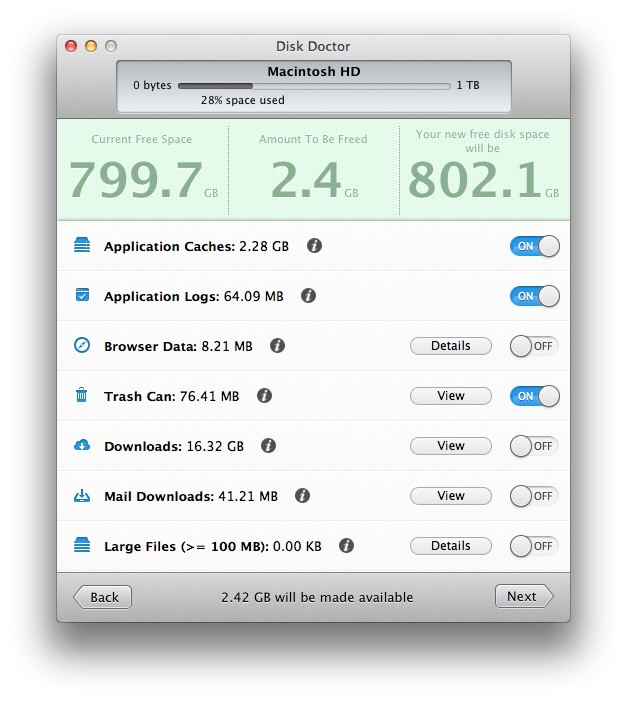 We store a lot of useful information on the disks of our Macs, and over time it becomes more and more. Various unnecessary and no longer relevant information is gradually accumulating, which also takes up disk space - the application cache, mail attachments and other large files hidden in the depths of the file system. Disk Doctor will help you monitor your Mac's disks and clean them up in a timely manner, preventing them from becoming full.
If you're running out of disk space, Disk Doctor will help you win it back.

temperature gauge
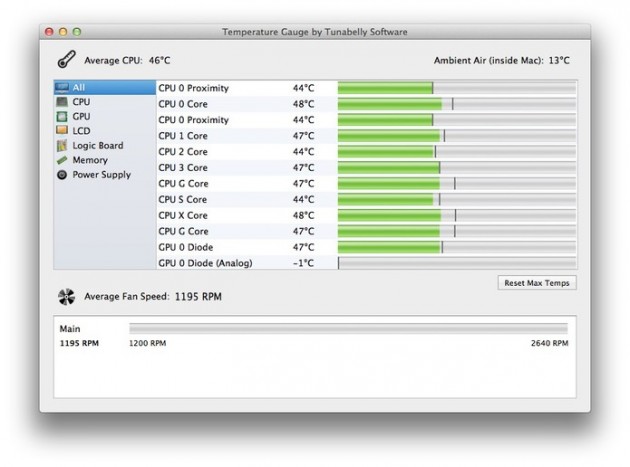 Nowadays, the development of technology has made it possible to negate cases of Mac overheating, but careless users still experience such situations. Luckily, with Temperature Gauge, you can monitor cooler speeds and temperatures by taking data from all the sensors on your Mac.
If you often load your Mac to the fullest or just want to always have a gauge panel at hand, use the Temperature Gauge.

Memory clean
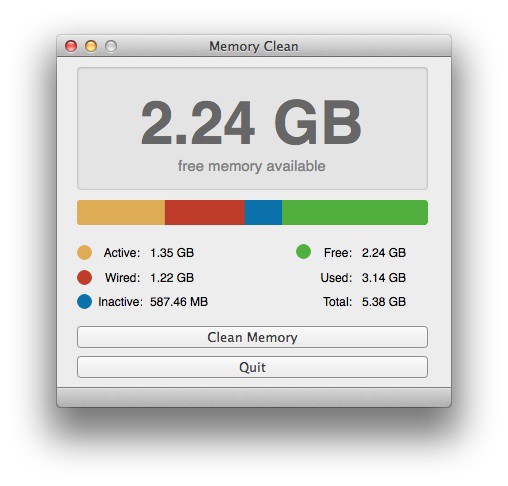 And the last resource that applications tend to “devour” is RAM or RAM. All applications and games consume memory during operation, and the longer they work, the more memory they eat. Running OS X Mavericks on Macs with less than 4GB of memory can be uncomfortable and cause lag. Memory Clean will help you identify gluttonous applications and free up memory in one click.
All users with a small amount of RAM can recommend Memory Clean.
Allows you to monitor the system status from the menu bar. This, to be honest, is a bit of a "geek" way. Therefore, today we will consider a simpler option that will suit switchers, novice users and everyone who has avoided communicating with the standard System Monitoring application (Activity monitor) before.
I am sure that each of you at least once launched this program with one of those, but the presence of a large amount of various information in the window can scare anyone away. To prevent this from happening next time, I propose to deal with all the subtleties that allow you to “squeeze all 100” out of the application.
Toolbar
By default, Activity Monitor is located in the Programs > Utilities folder on your computer. Once launched, you will see something like this:
As you probably already understood, the application itself is designed to provide an exhaustive answer to the question “what is going on in my system?”. And for this we need the following buttons:
End the process. If you notice that the system started to work slowly, most likely some application behaves not quite correctly. A cursory sorting of the two columns - CPU usage and amount of physical memory used - in most cases will help to identify the conflicting application. Of course, you can resort to the "Force Quit ..." box, which is hidden in . However, not all processes are shown in it, therefore, it is easier to close a hung application from the System Monitor.
Check. This button will remain inactive until you select any process. But after clicking on it, a special window will appear with three tabs that display detailed information:
- the title of the window contains the name of the process and its identifier (in this case, 18650);
- the parent process and user that launched this application;
- memory usage;
- various statistics like the number of threads or CPU time;
- and a list of open files the process is working on.

Button Make a selection helps to collect the most complete information about the selected process, to present it from several angles. To be honest, if you are not a Mac programmer, then you won’t be able to understand anything, in fact, like me 🙂
Drop-down menu and field filters is of no less value to us, as it allows you to quickly switch between several modes of displaying processes or find it by name. The dropdown menu offers the following options:
- "All Processes". This mode will show in general everything processes running on the system.
- The menu item "All processes, hierarchically" will display them in a tree, indicating "parents".
- "My Processes" will only show what was started by the current user.
- I think it is not worth explaining what will be presented in the list if the user selects "System processes" or "Processes of other users".
- With the last values - "Active" and "Inactive processes", "Processes in windows" - everything seems to be clear too.
And this is what the selection will look like. Each tab and extension is run in a separate process:

Processes and Applications
The most important information is located in the middle of the application, just below the toolbar. You probably noticed while testing the operation of filters and buttons that the contents of the list changed all the time. This is all because there are many processes running in the system that start and stop, start demanding more RAM or CPU time, and so on.
By default, this list is divided into several columns, displaying the process ID (PID), its name, username, percentage of processor utilization (%CPU), amount of physical memory, architecture type, and so on. For us, as I said a little higher, of particular interest is the% CPU and the amount of physical memory, which directly indicate the load on the system. If you click on any column, then the processes will be sorted in descending or ascending order (depending on how many times you click on the title 🙂).
For example, %CPU for most processes should not be very high unless you are doing some resource-intensive operations: during startup, this value can jump to 50-60% and decrease to zero after it is loaded. But if you encode music, then during the process the workload can constantly fluctuate around 80-90% and above. The situation is similar with physical memory - the less it is occupied, the faster the system can work.
The processor type is shown by three values: PowerPC for older Macs, Intel and Intel (), with the first of the Intels indicating the 32-bit architecture of the application.
You can enable or disable the display of some columns from the context menu of any column or via the menu View > Columns.
The bottom panel
Under the list of processes, you can find an equally useful panel with several tabs. They show more detailed information for each parameter: values and graphs with their own legend and customizable display. You can view a larger CPU load graph through the Window menu, by pressing ⌘+3, or by double-clicking on a small graph:

Similarly, you can evaluate the use of system memory, network adapter and space on hard drives or USB flash drives (I suspect that Firewire devices will also be shown in the list).
Icon in the Dock
One of the advantages of System Watcher is that you don't always have to keep the application window in front of your eyes. In most cases, the user still does not need the most complete and comprehensive information. Therefore, programmers taught the icon to change its appearance depending on the user's desire. All we need is to go to the context menu of the icon and select the option we would like to see. I set “CPU Usage” for myself, since it has the neatest icon 🙂 Although occasionally it needs to be changed to network/memory load.

In general, it’s not so scary, this System Monitor, right? But now you can more successfully deal with system freezes and, thereby, improve computer performance.
Today we will show several of these methods. Take the time to study them all, and then you can choose the most suitable one for yourself.
Dock
The easiest way to see what applications are currently running is to take a look at the Dock. If you see a glowing indicator under the application icon, then this application is open and running.
There's nothing wrong with this method, but it's limited in that it only shows windowed applications - those that run in the OS X GUI. It also doesn't allow you to do anything directly with the running application.
Finally, the aforementioned glowing indicators are small and can be hard to see, some people don't see them at all. Fortunately, there are more interesting ways to view lists of applications running on OS X.
Hit Command+Option+Escape and you'll see the Force Quit Programs window, which in OS X can be thought of as a simple task manager.

In this window, you will see an easy-to-read list of all active (running) applications in OS X, which will include all the applications that you would see in the Dock.
Despite the name of the window, you can use it to view a list of running applications and programs without terminating them.
The obvious advantage of the Command+Option+ESC window is the ability to directly affect the application. In particular, the application can be terminated if it stops responding. In general, this window is a simplified version of the "Control+ALT+DELETE" task manager from the Windows world.
The main limitation of the Force Quit window is that you can only see windowed OS X applications in it, and you cannot see various background processes (as is the case with the Dock).
The most powerful application and process management utility in the OS X GUI is System Monitor. This is a powerful task manager that will show not only all running and active applications, but also all active and inactive processes.
In other words, Activity Monitor shows just about everything running on the Mac, including the aforementioned windowed apps, background apps, menu bar items, system-level processes, other user processes, inactive processes, service daemons—or just about anything that runs as a process. on any level of OS X.
This utility is located in / Programs / Utilities /, but it can also be easily launched through Spotlight or Launchpad.

To simplify the list presented, call the processes submenu and select what you need, such as "All processes", "My processes", "System processes", etc. Don't forget about the search form on the right - it can be very useful in quickly finding a specific process.

System Monitor offers many tools and options, and is the most advanced way to view extended information on all active processes without resorting to the command line. This utility allows you to forcibly terminate processes and applications, sort processes by name, by PID, by user, by CPU usage, etc.
What's more, System Monitor will also provide you with general statistics on CPU usage, memory usage, disk and network activity, which can be useful when troubleshooting problems ranging from identifying the causes of inadequate system memory usage to understanding the causes of system stutters.

An added bonus is that System Monitor can be kept always on. In addition, you can pin it to the Dock and see real-time CPU and memory usage, disk and network activity.

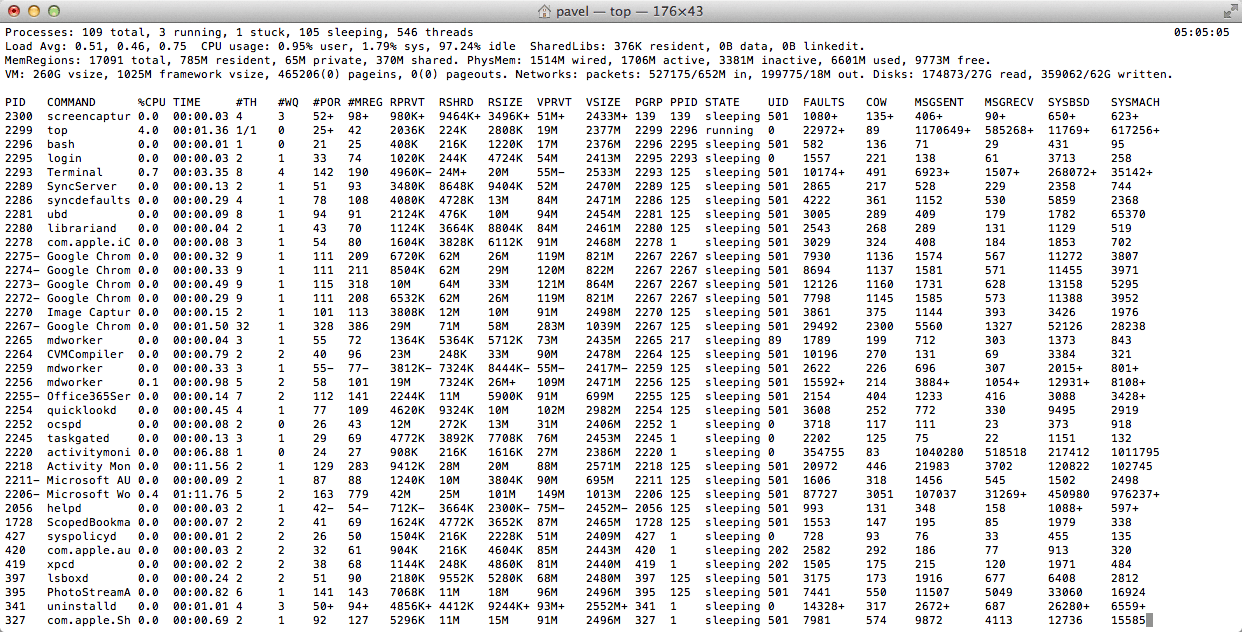
By accessing the command line, you can use several additional tools to view a list of all applications running on your Mac. In many ways, these tools can be thought of as command line versions of Activity Monitor. Today we will look at a couple of such tools: top and ps.
The top command will show you a list of all running processes and various statistics for each process. Usually, sorting by CPU usage or by memory usage is most useful.
You can sort processes by CPU using the command:
Sort by memory usage:
Information from top is updated in real time, while information from ps is not.
By default, the ps command will only show the processes of the current user, so it's not very convenient to use it just like that. But if you add a flag or two, then you can see all the processes. In particular, aux is a good combination of flags:
To see the entire output of the command, it is better to expand the Terminal window. But even in this case, you will be overwhelmed by the number of processes running (a common thing). Therefore, it is better to use the above command with the prefix more or less:
This command will allow you to page through processes without having to scroll up and down the Terminal window.

To find a specific process (or application), you can use the grep command like this:
ps aux|grep Process
You can also search by app name:
ps aux|grep "Application Name"
Which of the above options should you choose? You decide. Some users can use System Monitor or even the command line, while others will use the Force Quit Applications menu. In any case, do not forget to visit the pages of our website, and we will definitely tell you something else interesting about OS X.
Apple makes very reliable computers that can run for weeks or months without a reboot. Yes, and OS X, a pretty smart operating system that intelligently allocates system resources. Usually there is no need for an ordinary user to look behind the scenes of all this "kitchen", but if you want to control all the system resources of your Mac, you cannot do without special applications. These applications will be discussed in this article.
iStat Menus
One of the most famous utilities that provides detailed information about all the hardware components of your Mac (looking ahead, I will say that this is my favorite). The application allows you to fine-tune the display of the necessary elements directly on the menu bar, as well as arrange the necessary information in the drop-down menu. For example, I have processor, memory, battery, and network activity indicators in the menu bar, and with a glance I can always see how loaded the Mac is at the moment.
The display of information in the drop-down menu is implemented very conveniently, when hovering over a specific element, detailed consumption graphs are shown (per day, per week, per month). In addition, iStat Menus allows you to adjust the fan speed and create profiles for this.
If you want to monitor absolutely all the resources of your Mac - iStat Menus is ideal.
gfxCardsStatus
If you are the owner of a Mac with two video cards, I advise you to pay attention to this application. By default, the user cannot choose which graphics card to use because OS X switches between integrated and discrete graphics depending on the current load. The tiny free utility gfxCardsStatus aims to remedy this shortcoming. Now, if you need high performance or, on the contrary, maximum energy savings, you just need to select the appropriate item in the gfxCardsStatus menu. All in your hands!
Disk Doctor
We store a lot of useful information on the disks of our Macs, and over time it becomes more and more. Various unnecessary and no longer relevant information is gradually accumulating, which also takes up disk space - the application cache, mail attachments and other large files hidden in the depths of the file system. Disk Doctor will help you monitor your Mac's disks and clean them up in a timely manner, preventing them from becoming full.
If you're running out of disk space, Disk Doctor will help you win it back.
temperature gauge
Nowadays, the development of technology has made it possible to negate cases of Mac overheating, but careless users still experience such situations. Luckily, with Temperature Gauge, you can monitor cooler speeds and temperatures by taking data from all the sensors on your Mac.
If you often load your Mac to the fullest or just want to always have a gauge panel at hand, use the Temperature Gauge.
Memory clean
And the last resource that applications tend to “devour” is RAM or RAM. All applications and games consume memory during operation, and the longer they work, the more memory they eat. Running OS X Mavericks on Macs with less than 4GB of memory can be uncomfortable and cause lag. Memory Clean will help you identify gluttonous applications and free up memory in one click.
All users with a small amount of RAM can recommend Memory Clean.
It often happens that just one application or a running process can significantly degrade the performance of the entire operating system. This applies to both Windows computers and OS X devices. How can you identify such a program among a dozen running in the background?
It may sound strange, but the easiest and fastest way is to sometimes check the number of running applications. If you see that they literally do not fit, this is a clear sign of excessive loading of the operating system.

In addition, a list of running programs can be viewed in the Force Quit Applications menu. It is called either by a simple key combination Command + Option + Escape, or through the standard OS X menu.

In case you need a detailed report on the operation of the entire system, I advise you to use the built-in System Monitor utility, which can be found through the search. Here you will find almost everything - from CPU utilization to free hard disk space. It also provides the ability to instantly terminate a process that consumes too many OS X resources. A kind of analogue of the "Task Manager" in Windows.

For OS X lovers, there are certain commands for viewing a list of running programs. To launch the text version of System Monitor, you just need to enter one word.
Want to instantly identify the most voracious app? Sort them by CPU:
top -o cpu

Or by memory usage:
top -p size
As you can see, there are endless ways to monitor OS X activity. Since it is much easier for me to work with the usual utilities, I chose the standard System Monitor. However, for those who don't normally load their Mac with multiple desktops, simply quitting apps may well be fine.

 What are dead pixels and how to deal with them
 Ira Vaimer and her high-quality content In contact with Irina Vaimer's games
 YouTube (youtube) registration, login, mobile version and video download Is it worth downloading