Tcpdump how to stop after a given time. Tcpdump is a useful guide with examples. Displaying captured packets in HEX and ASCII using tcpdump -xx
If you need to analyze or intercept network packets in Linux, then it is best to use the console utility for this. tcpdump. But the problem arises in its rather complicated management. It will seem to an ordinary user that it is inconvenient to work with the utility, but this is only at first glance. The article will explain how tcpdump works, what syntax it has, how to use it, and will also provide numerous examples of its use.
Read also: Guides for setting up an Internet connection in Ubuntu , Debian , Ubuntu Server
Most developers of Linux-based operating systems include the tcpdump utility in the list of pre-installed ones, but if for some reason it is not in your distribution, you can always download and install it through "Terminal". If your OS is based on Debian, and these are Ubuntu, Linux Mint, Kali Linux and the like, you need to run this command:
sudo apt install tcpdump
During installation, you need to enter a password. Please note that it is not displayed when typing, you also need to enter a character to confirm the installation "D" and press Enter.
If you have Red Hat, Fedora or CentOS, then the installation command will look like this:
sudo yam install tcpdump
After the utility is installed, you can immediately use it. This and many other things will be discussed later in the text.
Syntax
Like any other command, tcpdump has its own syntax. Knowing it, you can set all the necessary parameters that will be taken into account when executing the command. The syntax is as follows:
tcpdump options -i interface filters
When using the command, you must specify the interface to track. Filters and options are not required variables, but they allow for more customization.
Options
Although the option is not required to be specified, it is still necessary to list the available ones. The table does not show their entire list, but only the most popular ones, but they are more than enough to solve most of the tasks.
| Option | Definition |
|---|---|
| -A | Allows you to sort packages with ASCII format |
| -l | Adds scrolling functionality |
| -i | After entering, you need to specify the network interface that will be monitored. To start monitoring all interfaces, enter the word "any" after the option |
| -c | Ends the tracking process after checking the specified number of packets |
| -w | Generates a text file with a verification report |
| -e | Shows the internet connection level of the data packet |
| -L | Displays only those protocols supported by the specified network interface |
| -C | Creates another file during package capture if its size is larger than the given one |
| -r | Opens a file for reading that was created with the -w option |
| -j | TimeStamp format will be used to write packets |
| -J | Allows you to view all available TimeStamp formats |
| -G | Serves to create a file with logs. The option also requires a temporary value, after which a new log will be created. |
| -v, -vv, -vvv | Depending on the number of characters in the option, the output of the command will become more detailed (the increase is directly proportional to the number of characters) |
| -f | Shows the domain name of the IP addresses in the output |
| -F | Allows reading information not from the network interface, but from the specified file |
| -D | Shows all network interfaces that can be used |
| -n | Deactivates display of domain names |
| -Z | Specifies the user under whose account all files will be created |
| -K | Skipping checksum analysis |
| -q | Brief information demonstration |
| -H | Allows detection of 802.11s headers |
| -I | Used when capturing packets in monitor mode |
Having analyzed the options, a little lower we will go directly to their applications. In the meantime, filters will be considered.
Filters
As mentioned at the very beginning of the article, you can add filters to the tcpdump syntax. Now the most popular of them will be considered:
All of the above filters can be combined with each other, so in the issuance of a command you will see only the information that you want to see. To understand the use of the above filters in more detail, it is worth giving examples.
Examples of using
Now the commonly used syntax of the tcpdump command will be given. It is impossible to list them all, since there can be an infinite number of their variations.
Viewing the list of interfaces
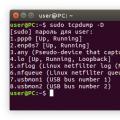
It is recommended that each user initially check the list of all his network interfaces that can be tracked. From the table above, we know that for this we need to use the option -D, so in the terminal run the following command:

As you can see, there are eight interfaces in the example, which can be viewed using the tcpdump command. The article will provide examples of ppp0, you can use any other.
Normal traffic capture
If you need to track one network interface, then you can do this using the option -i. Do not forget to specify the name of the interface after entering it. Here is an example of such a command:
sudo tcpdump -i ppp0
Please note: before the command itself, you need to enter "sudo", as it requires superuser rights.

Note: after pressing Enter, the "Terminal" will continuously display captured packets. To stop their flow, you need to press the key combination Ctrl + C.
If you run the command without additional options and filters, you will see the following format for displaying traced packets:
22:18:52.597573 IP vrrp-topf2.p.mail.ru.https > 10.0.6.67.35482 : Flags , seq 1:595, ack 1118, win 6494, options , length 594
Where it is highlighted:
- blue - the time the package was received;
- green - sender's address;
- purple - recipient's address;
- gray - additional information about tcp;
- red - packet size (displayed in bytes).
This syntax has the ability to display in a window "Terminal" without any additional options.
Capturing traffic with the -v option
As is known from the table, the option -v allows you to increase the amount of information. Let's take an example. Let's check the same interface:
sudo tcpdump -v -i ppp0

Here you can notice that the following line appeared in the output:
IP (tos 0x0, ttl 58 , id 30675, offset 0, flags , proto TCP (6) , length 52
Where it is highlighted:
- orange - protocol version;
- blue - protocol lifetime;
- green - field header length;
- purple - tcp package version;
- red - packet size.
You can also add an option to the command syntax -vv or -vvv, which will further increase the amount of information displayed on the screen.
Option -w and -r
The options table mentioned the ability to save all output data to a separate file so that they can be viewed later. This is the option -w. Using it is quite simple, just specify it in the command, and then enter the name of the future file with the extension ".pcap". Let's take a look at an example:
sudo tcpdump -i ppp0 -w file.pcap

Please note: while writing logs to a file, no text is displayed on the "Terminal" screen.
When you want to view the recorded output, you must use the option -r, after which write the name of the previously recorded file. It is applied without other options and filters:
sudo tcpdump -r file.pcap

Both of these options are great when you need to store large amounts of text for later parsing.
Filtering by IP
From the filter table, we know that dst allows you to display on the console screen only those packets that were received by the address that is specified in the command syntax. Thus, it is very convenient to view the packets received by your computer. To do this, in the command you just need to specify your IP address:
sudo tcpdump -i ppp0 ip dst 10.0.6.67

As you can see, in addition to dst, in the command we also registered the filter ip. In other words, we told the computer to pay attention to their IP address when selecting packets, and not to other parameters.
You can also filter outgoing packets by IP. Let's take our IP as an example. That is, now we will track which packets are sent from our computer to other addresses. To do this, run the following command:
sudo tcpdump -i ppp0 ip src 10.0.6.67

As you can see, in the command syntax we have changed the filter dst on the src, thereby telling the machine to look for the sender by IP.
Filtering by HOST
By analogy with IP in the command, we can specify a filter host to weed out packets with the host of interest. That is, in the syntax, instead of the IP address of the sender / recipient, you will need to specify its host. It looks like this:
sudo tcpdump -i ppp0 dst host google-public-dns-a.google.com

In the image, you can see that in "Terminal" only those packets are displayed that were sent from our IP to the google.com host. As you can understand, instead of the google host, you can enter any other.
As in the case of filtering by IP, in the syntax dst can be replaced with src to see the packets that are being sent to your computer:
sudo tcpdump -i ppp0 src host google-public-dns-a.google.com
Please note: the host filter must come after dst or src, otherwise the command will give an error. In the case of filtering by IP, on the contrary, dst and src come before the ip filter.
Applying the and and or filter
If you need to use several filters at once in one command, then for this you need to use the filter and or or(depending on the case). By specifying filters in the syntax and separating them with these operators, you "make" them work as one. For example, it looks like this:
sudo tcpdump -i ppp0 ip dst 95.47.144.254 or ip src 95.47.144.254

From the syntax of the command, it is clear that we want to display "Terminal" all packets that were sent to the address 95.47.144.254 and packets received by the same address. You can also change some of the variables in this expression. For example, instead of IP, specify HOST or replace the addresses themselves directly.
Port and portrange filter
Filter port great in cases where you need to get information about packets with a specific port. So, if you only want to see DNS responses or queries, you need to specify port 53:
sudo tcpdump -vv -i ppp0 port 53

If you want to view http packets, you need to enter port 80:
sudo tcpdump -vv -i ppp0 port 80

Among other things, it is possible to track a range of ports at once. For this, a filter is used. portrange:
sudo tcpdump portrange 50-80

As you can see, in conjunction with the filter portrange it is not necessary to specify additional options. You just need to set the range.
Protocol filtering
You can also display only traffic that matches a particular protocol. To do this, use the name of this very protocol as a filter. Let's look at an example udp:
sudo tcpdump -vvv -i ppp0 udp

As you can see in the image, after executing the command in "Terminal" only packets with the protocol were displayed udp. Accordingly, you can filter by others, for example, arp:
sudo tcpdump -vvv -i ppp0 arp
or tcp:
sudo tcpdump -vvv -i ppp0 tcp
net filter
Operator net helps filter out packets based on their network designation. Using it is as simple as the rest - you need to specify the attribute in the syntax net, then enter the network address. Here is an example of such a command:
sudo tcpdump -i ppp0 net 192.168.1.1

Packet size filtering
We haven't covered two more interesting filters: less and greater. From the table with filters, we know that they serve to display data packets larger ( less) or less ( greater) of the size specified after the attribute was entered.
Let's say we want to monitor only packets that do not exceed the 50 bit mark, then the command will look like this:
sudo tcpdump -i ppp0 less 50

Now let's display in "Terminal" packets larger than 50 bits:
sudo tcpdump -i ppp0 greater than 50

As you can see, they are applied in the same way, the only difference is in the name of the filter.
Conclusion
At the end of the article, it can be concluded that the command tcpdump is a great tool with which you can track any data packet transmitted over the Internet. But for this it is not enough just to enter the command itself in "Terminal". You can achieve the desired result only if you use all kinds of options and filters, as well as their combinations.
For UNIX systems, there are many different sniffers and traffic analyzers with a convenient graphical interface and a rich set of functions. But none of them can compare in flexibility, versatility and prevalence with the old-fashioned tcpdump. This utility is included with many Linux distributions and all BSD systems out of the box and can help you out when other tools are not available.
Introduction
The tcpdump utility is a command-line network packet sniffer that has neither a graphical nor pseudo-graphical interface. For beginners, it may seem clumsy and too old-fashioned, but in skillful hands it turns into a real Swiss knife for opening any network packets and protocols. Experienced sysadmins always recommend that beginners use tcpdump instead of any other utility because of the clarity and straightforwardness of its reports.
Tcpdump was born almost 25 years ago at the University of Berkeley, is still actively developed and continues to be the standard among similar tools for the UNIX operating system. The libpcap packet capture library developed specifically for it is now used by almost every sniffer for UNIX systems and many similar programs for Windows.
In this article, we will cover all aspects of working with tcpdump, from the basics of working with the program to how to use the utility to detect network attacks, anomalies, and various types of failures.
Alone with the console
Let's try to figure out how tcpdump works and from which side it should be approached. Open a terminal and run the program as root (like any sniffer, tcpdump must have full access to network interfaces), specifying the name of the network interface and limiting the number of output packets to ten:
# tcpdump -i wlan0 -c 10 -n
The -n switch disables the translation of IP addresses into DNS names. Now let's try to track the exchange only with a specific host, for example, with a home router:
# tcpdump -i wlan0 -c 10 -n host 192.168.0.1 and port 53
Let's see what tcpdump outputted to us, using the two lines shown in the screenshot "DNS query through the eyes of tcpdump" as an example. It can be easily understood that this is a DNS request (port 53) from host 192.168.0.101 to host 192.168.0.1 and the subsequent response. But what do all the other numbers and signs mean?
The numbers 16:22:41.340105 are the time the packet was sent, including millionths of a second (the so-called frac). The two letters IP, as you might guess, identify the network layer protocol used, followed by the address: the sending port and the address: the destination port of the packet. Everything that comes after the colon directly depends on the transport or application layer protocol used. tcpdump is familiar with some protocols and can decrypt them to a human-readable form, it leaves others as they are and simply lists the contents of the packet. In this case, tcpdump decoded the DNS messages and returned the string 49244+ A? ya.ru. (23) , which means: a request (A?) was sent to the address associated with the name ya.ru., the total packet length minus TCP / IP headers was 23 bytes. The first digit is the request ID.
In the next line, we see the answer, the presentation format of which is almost identical to the request, with the only difference being that now after the request identifier there is information about the number of records found (8/2/3) and the records themselves (A 213.180.204.3, A 77.88.21.3 , A 87.250.250.3...).
The arsenal of tcpdump has support for many protocols, thanks to which it can present in a readable form information about the TCP, UDP and ICMP, SMB / CIFS, NFS, AFS, AppleTalk protocols. But what if tcpdump doesn't know anything about the application layer protocol being used, or can't determine it? In a normal situation, it will simply output information about the package. It might look something like this:
Flags [.], seq 3666073194:3666074622, ack 3281095139, win 2000, options , length 1428
This is a TCP packet, the format of information about which is presented in tcpdump is as follows (fields are separated by commas):
- flags - set flags. Denoted by the symbols S (SYN), F (FIN), P (PUSH) and R (RST), a dot means no flags set;
- data-seqno - describes the data contained in the packet in the following format: first:last, where first and last are the sequence number of the first and last byte of the transmitted data, nbytes;
- ack - next sequence number (ISN + 1);
- window - window size;
- options - additional information can be specified here, for example (maximum segment size);
- length - the length of the packet.
All this data can be very useful while studying or debugging protocols and network applications, but they do not tell us anything about its contents. To see the contents of the package in hexadecimal format, use the -X flag:
# tcpdump -i wlan0 -c 10 -n -X host 192.168.0.1 and port 80
This function is very useful for parsing protocols in which data is transmitted in clear text, such as HTTP. For binary protocols and protocols with encryption, it will, of course, be useless.
You can also use the -v flag to get more information about a package. Then, after the IP in brackets, detailed information about the IP packet will appear:
(tos 0x0, ttl 64, id 8339, offset 0, flags , proto UDP (17), length 51)
In general, everything here is quite prosaic. First comes the type of service (TOS), followed by packet time to live (TTL), packet identifier, offset from the start of the first packet in the chain, flags, transport layer protocol used (TCP, UDP, ICMP), and length.

Advanced features
We have already covered most of the most important features of tcpdump, but its functionality is much wider. For example, we used the host and port statements to specify the address and port we want to filter the output, but what if we only want to see packets going to the specified address, but not outgoing from it? You can use the src operator for this:
# tcpdump -i wlan0 -c 10 -n src 192.168.0.1
There is also its reverse version dst, designed to indicate the destination address. As shown above, all operators can be combined using the and operator (monitoring network traffic, excluding SSH sessions and DNS requests):
# tcpdump -i wlan0 port not 22 and port not 53
You can also use or (or) and except (not). Also, tcpdump understands port ranges:
# tcpdump -i wlan0 -c 10 -n portrange 21-23
Able to filter packets by their size:
# tcpdump -i wlan0 -c 10 -n > 32 and<= 128
And understands subnet masks:
# tcpdump -i wlan0 c 10 -n src net 192.168.0.0/16 and dst net 10.0.0.0/8 or 172.16.0.0/16
One of the most interesting features of tcpdump is the ability to filter packets based on the content of specific bits or bytes in the protocol headers. For this, the following format is used: proto, where proto is the protocol, expr is the offset in bytes from the beginning of the packet header, and size is an optional field indicating the length of the data in question (default is 1 byte). For example, to filter only packets with the SYN flag (TCP handshake initiation) set, you would use the following entry:
# tcpdump "tcp==2"
How it works? Very simple. The 13 bytes of the TCP header contain exactly eight flags, one bit each. The second bit is reserved for the SYN flag. The above entry simply checks to see if this bit is set. By the way, a more readable form of this entry would look like this:
# tcpdump "tcp & tcp-syn != 0"
Practical use
The tcpdump utility is commonly used for two purposes: to debug the network, network applications, and new protocols, and to teach you the basics of TCP/IP. We will go the other way and use the power of tcpdump to detect host scans and network attacks.
On fig. Figure 1 shows what a classic TCP port scan done by Nmap looks like in tcpdump logs. You can clearly see how Nmap from the address 192.168.0.100 tries to establish a TCP connection with different ports by sending a SYN packet (S in the flags field). First, port 8888 is probed, an RST packet comes in response, which means that no service is listening on the port, then port 587 is probed with the same result. Finally, Nmap sends a SYN packet to port 22 (SSH) and receives a response in the form of a SYN-ACK packet:
192.168.0.100.43337 > 192.168.0.111.22: Flags[S], seq 2610024277, ... 43337 > 192.168.0.111.22: Flags [.], ack 1, ...
The port is open and now Nmap can successfully close the connection by sending an RST packet and move on to the next ports. However, it does something smarter: it sends an acknowledgment of receipt of the ACK packet and immediately moves on to the next ports. This behavior allows you to bypass some intrusion detection systems, but you can’t easily fool a person armed with a sniffer.
Pay attention also to the numbers of ports to be sorted out, they are not generated randomly, but are selected taking into account the greatest prevalence. This means that a fast scan is being performed, or more specifically, Nmap is most likely running without any flags at all.

Now let's look at another method for detecting open ports - SYN scanning (nmap -sS). This type of scan is usually called hidden, because during it a full TCP connection is never established, which means that information about the fact of the connection is not included in the logs. The tcpdump output for this kind of scan is shown in Figure 1. 2. It is very similar to the log of a regular TCP scan, but the scanner's response to open ports is now different:
192.168.0.100.48585 > 192.168.0.111.22: Flags[S], seq 1679394613, ... 48585 > 192.168.0.111.22: Flags[R], seq 1679394614, ... 
It can be seen that after receiving the SYN-ACK approval packet, the scanner does not complete the connection, but immediately terminates it, avoiding getting into the logs. On fig. 3 you can see the result of the UDP scan. Everything is very simple here, Nmap enumerates ports with possible UDP services, sending a packet of zero length to each of them. If the port is closed, the OS sends back an ICMP unreachable message:
16:41:48.798310 IP 192.168.0.100.61020 > 192.168.0.111.18869: UDP, length 0 
Otherwise, the port is considered open. Another scanning method is null scanning by sending packets with no flags set (nmap -sN). The reaction to such packets may vary depending on the operating system, but as you can see from the following listing, Linux responds to them by sending RST packets:
192.168.0.100.39132 > 192.168.0.111.256: Flags , win 3072, length 0 192.168.0.111.256 > 192.168.0.100.39132: Flags , ...
An attacker can also use Xmas scanning, in which packets have the FIN, URG, and PUSH flags set (the packet seems to glow with flags like a Christmas tree):
192.168.0.100.35331 > 192.168.0.111.5544: Flags , seq 3998959601, win 4096, urg 0, length 0
As you can see, the reaction to such packages is identical. An ACK scan (-sA) will appear in the tcpdump logs as sending multiple packets with the ACK flag set and responding to them by sending RST packets. However, if a firewall is installed on the system, there will be no response messages, and Nmap will be able to understand if the port is being filtered.
With the help of tcpdump, you can also track down various types of flooding. For example, a classic ICMP flood in the logs will look like this:
16:43:06.008305 IP 192.168.0.100 > 192.168.0.111: ICMP type-#68, length 1032 192.168.0.100 > 192.168.0.111: ICMP type-#183, length 1032 16:43:06.008831
Of particular importance here is the field containing the time the packet was received. No normal application will send many ICMP messages in a period of time equal to one thousandth of a second. Other types of flood (eg SYN) are defined in exactly the same way.
Interaction with other programs
One of the most important advantages of tcpdump is that the format of its reports during the existence of the program has actually become the standard for all sniffers and today it is understood by all more or less serious traffic analysis tools. For example, tcpdump can be used to generate a dump on a remote machine, then send it to the local machine and parse it with wireshark:
$ ssh [email protected] tcpdump -w - "port !22" | wireshark -k -i -
Here we used the -w - option to write the dump to stdout and redirected it to wireshark running on the local machine. In the same way, you can analyze traffic using snort:
$ ssh [email protected]"tcpdump -nn -i eth1 -w -" | snort -c /etc/snort/snort.conf -r -
By redirecting the output of the program to the input of grep, you can find various problems in the network, for example, identify packets with an incorrect checksum, which can be displayed using the -vv flag:
# tcpdump -nnvv -r dump.cap tcp | grep -v "tcp sum ok" | wc-l
Admin stuff
The ability to filter packets based on header data, which we discussed at the beginning of the first section, is very useful for debugging various protocols and finding network problems. For example, we can use it to catch network packets transmitted over the Cisco Discovery Protocol, through which Cisco routers exchange information about the topology and network status:
# tcpdump -nn -v -i eth0 -s 1500 -c 1 "ether == 0?2000"
In the same way, you can catch all packets transmitted via the DHCP protocol (DISCOVER, REQUEST, INFORM) in order to identify client connection problems:
# tcpdump -i eth0 -vvv -s 1500 "((port 67 or port 68) and (udp = 0x1))"
Or catch packets sent as part of POP3 authentication:
# tcpdump -i eth0 "tcp port pop3 and ip = 85 and ip = 83" -s 1500 -n
network grep
The tcpdump sniffer is good for its versatility and variety of capabilities, but it is not so easy and convenient to use it to search for specific data inside transmitted packets. This task is much better handled by ngrep, which is designed to display passing network packets that match a given mask.
For example, to find the parameters passed by the GET and POST methods within an HTTP session, you can use the following command:
# ngrep -l -q -d eth0 "^GET |^POST " tcp and port 80
Finding the slackers:
# ngrep -i "game*|p0rn|adult" -W byline -d eth0 > slackers.txt
We analyze SMTP traffic on all network interfaces:
# ngrep -i "rcpt to|mail from" tcp port smtp
tcpdump options
A table of the most interesting and useful tcpdump flags.
- -i [interface] - the network interface to listen on, specify any for all.
- -n Do not resolve IP addresses to DNS names.
- -nn Do not translate IP addresses and port numbers.
- -X - show package contents in text and hexadecimal formats.
- -XX - the same plus the contents of the Ethernet frame.
- -v, -vv, -vvv - increase the amount of information and packages shown (more, more, everything).
- -c [n] Show only the first n packets.
- -s [n] - number of bytes displayed for each packet (can be reduced for readability or increased for more information).
- -S - show absolute TCP sequence numbers.
- -e - show ethernet frame headers.
- -q - show less information (for readability).
- -E - decrypt IPsec traffic using the specified key.
- -w - save program dump to file, argument - used to specify stdout.
findings
In the hands of a knowledgeable user, tcpdump turns into a powerful tool not only for debugging, but also for anomaly research. Thanks to a rich set of operators and flags, you can use it to get out of the network air and explore what you really need.
Tcpdump is an extremely handy network analyzer that is very helpful for both network administrators and security people. Naturally, to get the maximum information when working with tcpdump, it is simply necessary to have an understanding of the TCP / IP protocol stack. For convenience, you can use more convenient and intelligent programs, for example, but often there are situations when it is not possible to install additional services on the machine under test, and then tcpdump is simply irreplaceable, the admin, for the sake of packet analysis, does not wake up to put on a unix server X- Windows, especially since on most unix systems, the tcpdump utility comes by default.
Understanding the TCP/IP protocol gives a wide scope for using the analyzer and troubleshooting and troubleshooting the network by parsing packets. Because optimal use of this utility requires a good understanding of network protocols and how they work, it's a funny situation in which an engineer needs to know and understand network communication mechanisms anyway. including tcpdump is useful in every way, from troubleshooting to self-education.
Below are a few options that will help you use this utility in the most complete and detailed way, especially since all these boxes and keys are quite easy to forget, and these examples are very useful for refreshing memory.
The first switch used is -n which prohibits attempts to convert addresses to domain names, thereby giving us clean IP addresses with ports.
The second is -X which tells each package to output both the hex (hexadecimal) and ASCII contents of the package.
And the last option is -S which replaces the output of relative TCP numbering with absolute numbering. The point is that with relative numbering, some problems may be hidden from your attention.
You need to understand that the main advantage of tcpdump over other utilities is that it allows for detailed and manual parsing of packets. You also need to remember that by default tcpdump uses only the first 68 bytes of the packet, incl. if you need to see more, then you should use the -s number switch, where number is the number of bytes to capture. If number is set to 0 , a full packet capture will occur, so it is better to use the value 1514, which will give a full capture of a standard Ethernet packet.
List of the most commonly used keys:
-c: set to check the size of the capture file before each next recording of the captured package, if the size is larger, then the file is saved and the recording goes to a new file
-e : print ethernet header (link layer) on each dump line
-i any: listen on all interfaces, in case you need all the traffic.
-n: Disables translation of addresses into domain or symbol names
-nn: Disable translation of addresses and ports to domain or symbol names
-q: Print information briefly, at the cost of reducing protocol information output.
-X: output both hex and ASCII contents of the package
-v, -vv, -vvv: Specifies additional information about captured packets to be output, allowing for a broader analysis.
A few examples to use:
# Standard packet output
tcpdump -nS
# Extended standard output
tcpdump -nnvvS
# Deep packet parsing
tcpdump -nnvvXS
# Most detailed traffic information
tcpdump -nnvvXSs 1514
Expressions allow you to perform more targeted scans and define traffic types. The ability to use expressions makes tcpdump a very productive tool in the hands of a sysadmin. There are three main types of expressions: type, dir, and proto.
The options of the type expression are host, net, and port.
To express the direction given by dir, the options src, dst, src or dst, and src and dst are available.
A few standard expressions:
host // analyze traffic based on IP address (also works with symbolic names if -n is not set)
tcpdump host 1.2.3.4
src, dst // analyze traffic only for a specific destination or transmitter
tcpdump src 2.3.4.5
tcpdump dst 3.4.5.6
net // capturing traffic belonging to a specific network
tcpdump net 1.2.3.0/24
proto // works with tcp, udp, and icmp. It must be remembered that proto is not mentioned
tcpdump icmp
port // analyze traffic from a specific port (incoming or outgoing)
tcpdump port 3389
src, dst port // filter based on incoming or outgoing port
tcpdump src port 1025
tcpdump dst port 3389
But the most powerful tool is operands, which allow you to set conditions for expressions and options for more detailed isolation of information about the analyzed traffic.
AND
and or &&
OR
or or ||
EXCEPT
not or!
TCP traffic from resource 10.15.123.33 with destination port 3379:
# tcpdump -nnvvS tcp and src 10.15.123.33 and dst port 3379
Traffic coming from network 192.168 with destination on networks 10 or 172.16:
# tcpdump -nvX src net 192.168.0.0/16 and dst net 10.0.0.0/8 or 172.16.0.0/16
Non-ICMP traffic with destination 192.168.0.2 and from network 172.16:
# tcpdump -nvvXSs 1514 dst 192.168.0.2 and src net 172.16.0.0/16 and not icmp
Traffic from hosts Eros or Ares , but not going to the standard SSH port (this expression requires name resolution):
# tcpdump -vv src eros or ares and not dst port 22
As you can see from the above examples, we can build any expression, for any purpose. Also, using complex syntax, we can exclude any type of traffic from the analysis.
Also, keep in mind that we can build queries that include groups and pools of options given in a single query. But in order for the tcpdump utility to pay attention to them, they must be placed in brackets, taking the expression in single quotes:
Traffic coming from host 10.0.2.4 to destination ports 3379 or 22:
# tcpdump ‘src 10.0.2.4 and (dst port 3379 or 22)’
It is also possible to filter based on TCP flags, for example, to isolate SYN or RST packets:
Parse all URG packets:
# tcpdump 'tcp & 32 != 0'
Parse all ACK packets:
# tcpdump 'tcp & 16 != 0'
Parse all PSH packets:
# tcpdump 'tcp & 8 != 0'
Parse all RST packets:
# tcpdump 'tcp & 4 != 0'
Parse all SYN packets:
# tcpdump 'tcp & 2 != 0'
This tutorial will show you how to isolate traffic in various ways—from IP, to port, to protocol, to application-layer traffic—to make sure you find exactly what you need as quickly as possible.
tcpdump is the tool everyone should learn as their base for packet analysis.
Install tcpdump with apt install tcpdump (Ubuntu), or yum install tcpdump (Redhat/Centos)
Let's start with a basic command that will get us HTTPS traffic:
tcpdump -nn S X port 443
04:45:40.573686 IP 78.149.209.110.27782 > 172.30.0.144 .443 : Flags [.], ack 278239097, win 28, options , length 0 0x0000: 4500 0034 0014 0000 2e06 c005 4e8e d16e E..4........N..n 0x0010: ac1e 0090 6c86 01bb 8e0a b73e 1095 9779 ....l......>...y 0x0020: 8010 001c d202 0000 0101 080a 3803 7b55 ............8.(U 0x0030: 4801 8100
You can get a single packet with -c 1 , or n number with -c n .
This showed some HTTPS traffic, with a hex display visible on the right portion of the output (alas, it’s encrypted). Just remember—when in doubt, run the command above with the port you're interested in, and you should be on your way.
Examples
PacketWizard™ isn't really trademarked, but it should be.

a practitioner preparing to run tcpdump
Now that you are able to get basic traffic, let’s step through numerous examples that you are likely to need during your job in networking, security, or as any type of PacketWizard™.
Everything on an interface
Just see what's going on, by looking at what's hitting your interface.
Or get all interfaces with -i any .
tcpdump -i eth0
Find Traffic by IP
One of the most common queries, using host , you can see traffic that's going to or from 1.1.1.1.
expression types:
host , net , and port .
src and dst .
host , net , and port .
tcp , udp , icmp , and many more.
tcpdump host 1.1.1.1
06:20:25.593207 IP 172.30.0.144.39270 > one.one.one.one .domain : 12790+ A? google.com. (28) 06:20:25.594510 IP one.one.one.one .domain > 172.30.0.144.39270: 12790 1/0/0 A 172.217.15.78 (44)
If you only want to see traffic in one direction or the other, you can use src and dst .
tcpdump src 1.1.1.1
tcpdump dst 1.0.0.1
Finding Packets by Network
To find packets going to or from a particular network or subnet, use the net option.
You can combine this with the src and dst options as well.
tcpdump net 1.2.3.0/24
Get Packet Contents with Hex Output
Hex output is useful when you want to see the content of the packets in question, and it's often best used when you're isolating a few candidates for closer scrutiny.
tcpdump -c 1 -X icmp

Summary
Here are the takeaways.
- tcpdump is a valuable tool for anyone looking to get into networking or .
- The raw way it interfaces with traffic, combined with the precision it offers in inspecting packets make it the best possible tool for learning TCP/IP.
- Protocol Analyzers like Wireshark are great, but if you want to truly master packet-fu, you must become one with tcpdump first.
Well, this primer should get you going strong, but the man page should always be handy for the most advanced and one-off usage scenarios. I truly hope this has been useful to you, and feel free to if you have any questions.
notes
- I'm currently (sort of) writing a book on tcpdump for No Starch Press.
- The leading image is from SecurityWizardry.com .
- Some of the isolation filters borrowed from
WHY TCPDUMP?
Tcpdump is the premier network analysis tool for security professionals. For those who want to get a complete understanding of TCP / IP, it is imperative to have a sufficient understanding of this important application. Many people prefer to use higher level tools like Wireshark, but I think this is a mistake.
When you use a tool that displays network traffic in a more natural (simple) way, the complexity of the analysis falls directly on the person, not the application. This approach develops an understanding of the TCP/IP suite, which is why I highly recommend using tcpdump instead of other tools whenever possible.
15:31:34.079416 IP (tos 0x0, ttl 64, id 20244, offset 0, flags , proto: TCP(6), length: 60) source.35970 > dest.80: S, cksum 0x0ac1 (correct), 2647022145: 2647022145 (0) Win 5840 0x0000: 4500 003C 4F14 4006 7417 0AFB 0257 E .. 0x0010: 4815 222A 8C82 0050 9DC6 5A41 0000 0000 H. "* ... P..za .... 0x0020: A002 16D0 0X0020 0000 0204 05b4 0402 080a ................ 0x0030: 14b4 1555 0000 0000 0103 0302
BASICS
Below are a few options that you can use when configuring tcpdump. They are easy to forget and/or confuse with other types of filters like Wireshark, so this page can serve as a reference for you. Here are the main ones that I myself like to keep in mind, depending on what I watch.
OPTIONS
- -i any: listen on all interfaces to see if you see any traffic.
- -i eth0: listen on interface eth0.
- -D: Show list of available interfaces
- -n: Display IP addresses instead of hostnames.
- -nn: Display IP addresses and port numbers instead of hostnames and protocol names.
- -q: Displays the minimum amount of information about a package.
- -t: Don't display timestamp on every line.
- -tttt: Specifies that timestamps are output in the default format for each line.
- -X: Show package contents in both hex and ASCII.
- -XX: Same as -X, but also shows ethernet header.
- -v, -vv, -vvv : Increase the amount of package information returned.
- -c: only get x number of packets and then stop.
- -s: Specify the snaplength (size) of the capture in bytes. Use -s0 to get everything, unless you intentionally grab less.
- -S: Print absolute sequence numbers.
- -e: Get ethernet header.
- -q: Show minimal package information.
- -E: Decrypt IPSEC traffic by providing the encryption key.
EXPRESSIONS
In tcpdump, expressions allow you to truncate different types of traffic and find exactly what you're looking for. Mastering expressions and being able to combine them creatively is what makes tcpdump truly powerful.
There are three main types of expressions: type, dir, and proto.
Option types: host, network, and port.
Directories allow you to do src, dst, and combinations of these.
The protocol allows you to define: tcp, udp, icmp, ah and many more.
EXAMPLES
So now that we've seen what options we have, let's look at some real world examples that we're likely to see in our daily work.
MAIN MESSAGE
Just see what's going on by looking at all the interfaces.
# tcpdump -i any
SPECIFIC INTERFACE
A basic view of what is happening on a particular interface.
# tcpdump -i eth0
PRESENTING RAW OUTPUT
Verbose output without resolving hostnames or port numbers, absolute sequence numbers, and human-readable timestamps.
# tcpdump -ttttnnvvS
FIND TRAFFIC BY IP
One of the most common queries, this will show you the traffic from 1.2.3.4, be it the source or the destination.
# tcpdump host 1.2.3.4
VIEW MORE INFORMATION ABOUT HEX PACKAGE
Hexadecimal output is useful when you want to see the contents of packages in question, and is often best used when you're isolating multiple candidates for closer scrutiny.
# tcpdump -nnvXSs 0 -c1 icmp tcpdump: listening on eth0, link-type EN10MB (Ethernet), 23:11:10.370321 IP (tos 0x20, ttl 48, id 34859, offset 0, flags , length: 84) 69.254.213.43 > 72.21.34.42: icmp 64: echo request seq 0 0x0000: 4520 0054 882b 0000 3001 7cf5 45fe d52b E..T.+..0.|.E..+ 0x0010: 4815 222a 0800 354 Hd 272a 000 "..50"..%..D 0x0020: ae5e 0500 0809 0a0b 0c0d 0e0f 1011 1213 .^............... 0x0030: 1415 1617 1819 1a1b 1c1d 1e1f 2021 2223 ... ..........!"# 0x0040: 2425 2627 2829 2a2b 2c2d 2e2f 3031 3233 $%&"()*+,-./0123 0x0050: 3435 3637 4567 1 packets captured 1 packets received by filter 0 packets dropped by kernel
FILTERING BY SOURCE AND DESTINATION
Singling out traffic based on source or destination is very easy using src and dst.
# tcpdump src 2.3.4.5 tcpdump dst 3.4.5.6
SEARCH PACKAGES OVER THE NETWORK
To find packets to or from a specific network, use the net option. You can combine this with the src or dst options.
# tcpdump net 1.2.3.0/24
SHOW TRAFFIC ASSOCIATED WITH A SPECIAL PORT
You can find a specific traffic port using the port option followed by a port number.
# tcpdump port 3389 tcpdump src port 1025
SHOW TRAFFIC OF ONE PROTOCOL
If you are looking for a specific type of traffic, you can use tcp, udp, icmp, and many more.
# tcpdump icmp
SHOW IP6 TRAFFIC ONLY
You can also find all IP6 traffic using the protocol option.
FIND TRAFFIC USING PORT BANDS
You can also use the port range to find the traffic.
# tcpdump portrange 21-23
FIND TRAFFIC BASED ON PACKAGE SIZE
If you are looking for packages of a specific size, you can use these options. You can use small, big, or whatever symbols you expect from math.
# tcpdump less than 32 tcpdump greater than 64 tcpdump<= 128
WRITTEN RECORDS TO FILE
It is often useful to save the output of batches to a file for later analysis. These files are known as PCAP (PEE-cap) files and can be processed by hundreds of different applications, including network analyzers, intrusion detection systems, and of course tcpdump itself. Here we are writing a file called capture_file using the -w switch.
# tcpdump port 80 -w capture_file
READING PCAP FILES
You can read PCAP files with the -r switch. Note that you can use all the regular commands in tcpdump when reading in a file; you're only limited by the fact that you can't capture and process something that doesn't exist in the file.
# tcpdump -r capture_file
ADVANCED
Now that we've seen what we can do with the basics with some examples, let's look at some more advanced stuff.
IT'S ALL ABOUT COMBINATIONS
Making these different things individual is powerful, but the real magic of tcpdump comes from being able to combine options in creative ways to isolate exactly what you're looking for. There are three ways to make combinations, and if you've studied programming at all, they'll be very familiar to you.
AND
and or &&
OR
or or ||
EXCEPT
not or!
Here are some examples of combined commands.
FROM A SPECIFIC IP AND ASSIGNED TO A SPECIFIC PORT
Let's find all traffic from 10.5.2.3 to any host on port 3389.
Tcpdump -nnvvS src 10.5.2.3 and dst port 3389
FROM ONE NETWORK TO ANOTHER
Let's look at all the traffic coming from 192.168.x.x and moving towards networks 10.x or 172.16.x.x and we'll show the hex output without the hostname and one level of extra detail.
Tcpdump -nvX src net 192.168.0.0/16 and dst net 10.0.0.0/8 or172.16.0.0/16
NON-ICMP TRAFFIC GOING TO A SPECIFIC IP
This will show us all traffic going to 192.168.0.2 that is not ICMP.
tcpdump dst 192.168.0.2 and src net and not icmp
TRAFFIC FROM A HOST THAT IS NOT IN A SPECIFIC PORT
This will show us all traffic from the host that is not SSH traffic (assuming the default port is used).
Tcpdump -vv src mars and not dst port 22
As you can see, you can create queries to find just about anything you need. The key is to first define exactly what you are looking for and then build the syntax to isolate the specific type of traffic.
Complex grouping and special characters
Also keep in mind that when creating complex queries, you may need to group your parameters using single quotes. Single quotes are used to tell tcpdump to ignore some special characters - in this case, the one in the "()" brackets. The same method can be used to group using other expressions such as host, port, network, etc. Look at the below command.
# Traffic that's from 10.0.2.4 AND destined for ports 3389 or 22 (wrong) tcpdump src 10.0.2.4 and (dst port 3389 or 22)
If you tried to run this very useful command on another occasion, you will get a parenthesis error. You can fix this by escaping the parentheses (by prefixing each with a \) or by putting the entire command in single quotes:
# Traffic that's from 10.0.2.4 AND destined for ports 3389 or 22 (correct) # tcpdump "src 10.0.2.4 and (dst port 3389 or 22)"
Isolate specific TCP flags
You can also capture traffic based on certain TCP flag(s).
[NOTE: The filters below find these various packets because tcp notices offset 13 in the TCP header, the number represents the location in a byte, eh! = 0 means that this flag is set to 1, i.e. it is on. ]
Show all URGENT (URG) packages...
# tcpdump "tcp & 32!=0"
Show all ACKNOWLEDGE packages (ACK) …
# tcpdump "tcp & 16!=0"
Show all PUSH packages (PSH) …
# tcpdump "tcp & 8!=0"
Show all RESET packets (RST) ...
# tcpdump "tcp & 4!=0"
Show all SYNCHRONIZE packages (SYN) ...
# tcpdump "tcp & 2!=0"
Show all FINISH (FIN) packages...
# tcpdump "tcp & 1!=0"
Show all SYNCHRONIZE / ACKNOWLEDGE packages (SYNACK) …
# tcpdump "tcp=18" [Note: only the PSH, RST, SYN, and FIN flag is shown in the output of the tcpdump field. The URG and ACK are displayed, but they are shown elsewhere in the output than in the flags field. ]
However, as with the most powerful tools, there are many ways to do what you need. The following example shows another way to capture packets with specific TCP flag sets.
# tcpdump "tcp == tcp-syn"
Remove RST flags with the tcpflags option...
# tcpdump "tcp == tcp-rst"
Remove FIN flags with tcpflags...
# tcpdump "tcp == tcp-fin" [Note: the same method can be used for other flags; they have been omitted in the interest of saving space. ]
Identifying noteworthy traffic
Finally, there are a few quick recipes you'll want to remember to catch specific and specialized traffic, such as bad/probably malicious packets.
PACKAGES WITH REGULAR RST AND SYN KITS (THIS SHOULD NOT BE)
# tcpdump "tcp=6"
FIND HTTP PLAIN TEXT AND GET REQUEST
# tcpdump "tcp=0x47455420"
FIND SSH CONNECTIONS ON ANY PORT (THROUGH THE BANNER)
# tcpdump "tcp[(tcp>>2):4] = 0x5353482D"
PACKETS WITH TTL LESS THAN 10 (GENERALLY SHOW PROBLEM OR USE TRACEROUTE)
# tcpdump "ip< 10"
EVIL BIT PACKAGES
# tcpdump "ip & 128 != 0"
Conclusion
tcpdump is a valuable tool for anyone who wants to get into network or information security.
The unusual way it interacts with traffic, combined with the accuracy it provides in packet inspection, makes it the best tool for learning about TCP/IP.
Protocol analyzers like Wireshark are great, but if you want to really master packets, you must first master tcpdump.
All in all, this tutorial should help you get strong, but the man page should always be handy for the most advanced and one-time use cases. I sincerely hope this was helpful to you and feel free to contact me if you have any questions.
How is the training going?
- We hold evening online lectures on our platform or study full-time on the basis of the Kiev office.
- We will ask you about a convenient time for practice and adjust: we understand that there is not enough time to study.
- If you want an individual schedule, we will discuss and implement it.
- We will set clear deadlines for self-organization. A personal curator will be in touch to answer questions, advise and motivate you to adhere to the deadlines for passing exams.
We will also help you:
 Tcpdump - a useful guide with examples
 Key management Key distribution involving a key distribution center
 Which files infect macro viruses